Threat hunt AI: How we built an AI security analyst on AWS for under $500/month
A look inside Grow Therapy's Claude-powered threat hunting system: multi-phase AI analysis, noise reduction, and a sub-$500/month AWS setup.
Thoughts
·
4 min

Threat hunt AI: How we built an AI security analyst on AWS for under $500/month
This article was written by Pablo Vidal.
As a healthcare platform, we require proactive security coverage across every system that touches sensitive data. We run a suite of automated threat hunts every day across AWS, Okta, Google Workspace, GitHub, CrowdStrike, Slack, Stripe, and a dozen other services.
The whole thing costs about $500/month. It runs on ECS Fargate, a few Lambda functions, and Claude.
This post covers how we built it, what went well, and what we'd change.
Extending threat detection with LLMs
Fifteen log sources flow into our Snowflake warehouse: CloudTrail, Okta, Google Workspace, GitHub, CrowdStrike, Auth0, GCP, Slack, Stripe, Looker, HubSpot, Retool, and a couple of internal services. Separately, Datadog holds about 14 days of searchable logs.
SQL threat detections handle deterministic patterns, like WHERE event_name = 'ConsoleLogin' AND source_ip_country IN ('RU', 'CN', 'KP'). In our setup, Snowflake tasks run every 15 minutes. Each detection is a YAML file with a SQL query, a lookback window, deduplication rules, and a severity; this constitutes the majority of our alert volume.
But then there’s everything you can’t write a rule for, or may not know how to write a rule for because you’re not an expert in that threat surface. (We know AWS and Okta well, but HubSpot audit logs?)
There’s a growing body of work showing that LLMs are well-suited to run this kind of proactive threat detection. Anthropic runs their own Claude-powered security operations center (SOC) internally. Slack’s security engineering team published a great post in December 2025 (Streamlining Security Investigations with Agents) describing a multi-agent system where a Director, domain Experts, and a Critic collaborate on alert investigations.
We learned from what these teams shared, and built our own version on top of infrastructure we already had.
How it runs on AWS
Three decisions shaped the architecture:
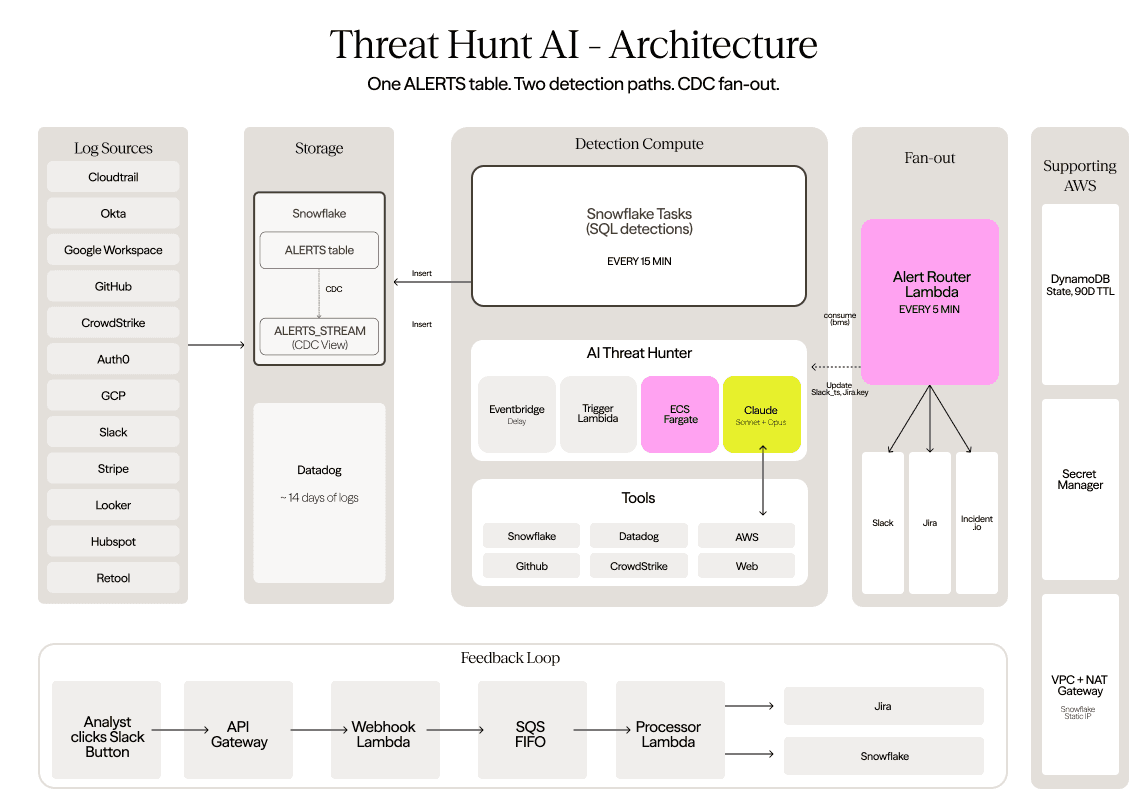
Reuse existing data infrastructure. The security logs already exist in Datadog and Snowflake. The security team reads from the same APIs and tables that engineering uses. We didn't build a separate ingestion pipeline or stand up a security-specific data store. This is why the Datadog line item in the cost table is $0: we're piggybacking on infrastructure the company already pays for.
No long-running services. Each hunt is a Docker container that runs as an ECS Fargate task (1 vCPU, 2GB of memory). It starts, runs the investigation (usually 15–45 minutes), writes findings to Snowflake, and stops. EventBridge triggers hunts on a cron schedule, and a small Lambda handles the ECS task launch.
One alert table for everything. Both SQL detections and AI hunts write to the same Snowflake ALERTS table. The downstream pipeline (routing to Slack, creating Jira tickets, tracking state) doesn't need to know where an alert came from, and we can add new detection types without changing anything downstream. A Lambda polls a change data capture (CDC) stream on that table every 5 minutes, consuming new rows inside a transaction. The stream offset only advances on commit, so if anything fails mid-way, it rolls back and retries next cycle. A second Lambda handles Slack button clicks and Jira webhooks. A third processes actions asynchronously off SQS.
State lives in DynamoDB (90-day TTLs) for short-term tracking and in Snowflake for anything persistent. The only non-obvious piece of infrastructure: a VPC with a NAT Gateway, because Snowflake requires a static IP for network allowlisting. Credentials live in Secrets Manager. Everything is Terraform.
Component | Monthly cost |
|---|---|
Claude API (Sonnet + Opus) | $250–400 |
Snowflake compute | $60–90 |
ECS Fargate | $10–20 |
Lambda, DynamoDB, NAT Gateway | $5–10 |
Additional Datadog ingestion | $0 (already paying for observability) |
Total | $320–510 |
We track token usage per hunt in DynamoDB and generate cost reports weekly. Every hunt logs its input tokens, output tokens, cache hits, and computed cost.
Defining a hunt in YAML
The AI hunts are where the interesting design decisions live. We don't write these by hand. The repo carries an AGENTS.md with threat hunt conventions and ~20 existing hunts as working examples. That's enough context for Claude to take a one-paragraph description like “hunt Snowflake for privilege escalation, off-hours bulk extraction, and queries against sensitive tables by non-clinical roles”.
Here's a cut-down version of our CloudTrail hunt. The key sections are the objective (what to investigate, in plain English), severity_guidelines (how to calibrate judgment), and false_positives (patterns we already know are benign):
id: aws_cloudtrail
name: AWS CloudTrail Security
status: production
enable_aws_tools: true
enable_snowflake_tools: true
enable_github_tools: true
schedule:
day_of_week: daily
lookback_hours: 24
timeout_minutes: 45
objective: |
Investigate AWS CloudTrail audit logs for security anomalies.
HIGH PRIORITY:
- IAM privilege escalation
- Security group opened to 0.0.0.0/0 on sensitive ports
- Root account usage
- CloudTrail/GuardDuty/Config disabling
Filter out:
- Known CI/CD service accounts
- Terraform/CloudFormation automation
severity_guidelines:
critical: |
- Root account API usage or console login
- CloudTrail logging disabled
- Evidence of credential compromise
high: |
- New IAM user with admin privileges
- MFA disabled on privileged account
indicators:
- name: "Root account usage"
severity_boost: critical
- name: "IAM privilege escalation"
severity_boost: high
false_positives:
- pattern: "CI/CD automation"
mitigation: "Filter by known automation role ARNs"
The objective is plain English. The severity guidelines tell the model how to calibrate its judgment. The false positives encode things we've already learned aren't worth alerting on. The enable_*_tools flags control which APIs the model can call during the hunt, since you don't want the CloudTrail hunt wasting time querying CrowdStrike if it's not relevant for the investigation.
Multi-phase analysis: Why single-shot doesn't work
The first version of this was simple. Essentially, we told Claude the objective, gave it the tools, and tried to one-shot it. The results were bad, full of vague findings and surface-level observations. The model would make three or four queries, see something mildly unusual, and call it a day.
During autonomous operations, Claude can overstate findings and occasionally invent evidence it didn't actually find. That said, this is a moving target. As model security capabilities improve, especially around evidence handling and autonomous investigation, we expect this phase to get better, not disappear. For now, we still treat explicit validation as part of the system design.
The fix was to structure the investigation the way a human would. A real analyst doesn't glance at one dashboard and file a report. They dig through data, build a picture of normal behavior, compare what they're seeing against that baseline, pull in additional context, and only then decide whether something is worth escalating. So the analysis runs in five phases:
Phase 1: Data gathering. Uses Sonnet, the faster and cheaper model. It makes up to 100 tool calls: querying Datadog logs, running Snowflake SQL, calling the CloudTrail API, looking up Okta users, etc. This is pure legwork. Sonnet costs a fifth of what Opus does, and speed matters more than reasoning depth when you're just pulling data. (We tried Opus with extended thinking for every phase early on. It's better for reasoning but irrelevant for data gathering. Switching Phase 1 to Sonnet alone cut costs by about 60%.)
Phase 2: Baseline comparison. Switches to Opus with extended thinking.. It compares the data against 1-day and 7-day baselines. It looks for shifts in volume, rarity, and sequence: whether an API call is new for that actor, whether the same behavior appeared in the prior day or week, whether peers in the same role do similar things, and whether the activity clusters around other suspicious events.
Phase 3: Context enrichment and analysis. Still Opus. For any actor, resource, IP, service account, or behavior pattern that looks off, it pulls full context: activity timelines, peer behavior, privilege level, ownership metadata, historical alerts, and whether the pattern has appeared before.
Phase 4: Confidence scoring. Still Opus with extended thinking, the model assigns a confidence level to each potential finding. We’ve tuned this to reduce noise for our team and ensure we’re prioritizing investigations appropriately.
Phase 5: Adversarial validation. This is the phase we spent the most time on and it wasn't in the original design. The first version only had four phases, and about a third of confirmed findings were things a human would have dismissed with 30 seconds of context. Adding this step cut the noise substantially. Each surviving finding gets one more pass where the model is explicitly instructed to argue against itself. It has to:
Call
get_finding_pattern_historyto check if this type of finding has historically been a false positive (specifically: >80% FP rate with at least 3 prior occurrences).Call
get_actor_finding_historyto see whether this actor has been flagged before and what happened. If the actor has repeatedly triggered the same finding and analysts marked it false positive, that lowers confidence; if prior findings were confirmed or unresolved, it increases the reason to keep the alert.Actively search for counter-evidence. Is there a legitimate business reason for this behavior? Is the "suspicious" IP actually a corporate VPN? Is the "anomalous" API call coming from a known automation account?
The model can only reject a finding if it produces specific counter-evidence. It avoids claims like "this seems normal", instead it adds concrete proof like a matching allowlist entry, a documented service account, or a finding pattern with an established FP history. If the counter-evidence is vague or absent, the default is KEEP.
Handling noise: False positives & deduplication
To reduce noisy alerts, we need to handle false positives and duplicates (where the same real finding appears more than once, due to suspicious activity persisting across multiple hunts).
False positives
When we write a hunt, we include patterns we already know are benign in the YAML. For the CloudTrail hunt, that's CI/CD automation from Terraform, AWS service-linked role activity, SSO federation events, and auto-scaling. The model gets these before it starts, so it doesn't waste time investigating them (or worse, flagging them).
We also create a feedback loop where if an analyst clicks “false positive” on a Slack alert, that action flows to Jira and syncs back to Snowflake. Before each hunt runs, a SQL query checks the last 90 days of resolved alerts, and any finding with 3+ occurrences and an 80%+ false positive rate gets injected into the system prompt as a known FP (surfacing during get_finding_pattern_history in Phase 5). This frequency-based filter is simple, it works, and it’s easy to debug if something goes wrong.
Finally, Phase 5 (adversarial validation) made a huge difference in production quality. Without this phase where the model argues against itself, about 40% of findings were noise. With it, most of what surfaces is worth looking at.
Deduplication
Each finding gets a fingerprint: a SHA-256 hash of the hunt ID, title, affected actor, and severity. Before insertion, the system checks the ALERTS table for anything with a matching fingerprint or exact title match in the last 48 hours. If there's a potential match, a separate Claude call (Sonnet, single-shot, max 50 tokens) compares the new finding with the existing one and decides: DUPLICATE or NEW.
This prevents the same finding from generating a new Slack alert every day. If the underlying activity is still happening, the existing ticket stays open. If something meaningfully changed (different actor, different severity, different evidence) it comes through as a new alert.
Lessons from building this
A few things we'd tell ourselves if we were starting over:
The data pipeline matters more than the AI. Get your logs into a queryable store like Snowflake or BigQuery. If your logs aren't centralized it’ll be harder to orchestrate a detection system that scales.
Existing observability spend is a cheat code. If you already have Datadog, you already have 14 days of searchable logs, metrics, and traces. The Datadog bill remains the same regardless of use. The AI reads from the same APIs your engineers use for debugging with its own dedicated security role.
Build the feedback loop before deploying anything. The system that lets analysts mark false positives, stores those resolutions, and feeds them back into future hunts needs to exist from day one. Without it, you generate noise, people tune out, and you spend weeks rebuilding trust.
Do signal-to-noise tuning in staging mode. Every new hunt should run against production data but write to a staging table, meaning it doesn’t generate any alerts until we’ve found the right signal-to-noise ratio. We started with two hunts on our highest-risk data source and expanded from there. Our first CloudTrail hunt generated 15+ findings per run without tuning it in staging. After staging, it settled to 2–3.
Start narrow on tools. The system has 40+ tools across 7 categories now, but we didn't need all of them from day one. The first five hunts used Datadog and Snowflake only. AWS, Okta, GitHub, CrowdStrike, and web tools got added over time as specific hunts needed them. Having a large set of tools available to the LLM might bloat up the LLM’s context window and lower the signal to noise ratio.
Cost tracking is not optional. We didn't add it until a month in and had to reconstruct token usage from CloudWatch logs. Now every hunt logs its token counts and computed cost to DynamoDB on completion. Build that into the pipeline before you deploy.
Where it stands today
Twenty hunts run daily. SQL detections run every 15 minutes. Fifteen log sources are monitored for ingestion health (a separate health check system verifies whether expected log volumes are arriving).
The weekly automated report posts to Slack every Friday: how many hunts ran, how many findings, how many were marked as FPs, token usage, and cost. The team reviews it to decide whether any hunts need tuning.
For a healthcare company, this is about the trust that therapists and clients place in the platform when they share sensitive information. Proactive coverage across every system, every day, is part of how we take that seriously and building it on infrastructure we already had made it possible at a scale that wouldn't have been realistic otherwise.
Grow Therapy is building technology to make therapy more accessible. We're hiring across engineering. See open roles.


